Categories: Featured Articles » Practical Electronics
Number of views: 90337
Comments on the article: 1
Electronic oscilloscope - device, principle of operation
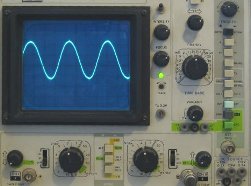 Amateur radio, as a hobby, is a very exciting activity, and, one can say, addictive. Many come into it in the wonderful school years, and over time, this hobby can become a profession for life. Even if you can’t get a higher radio engineering education, independent study of electronics allows you to achieve very high results and success. At one time, Radio magazine called such specialists engineers without diplomas.
The first experiments with electronics begin, as a rule, with the assembly of the simplest circuits, which begin to work immediately without adjustment and setup. Most often these are various generators, calls, unpretentious power supplies. All this can be collected by reading a minimal amount of literature, just descriptions of repeatable patterns. At this stage, as a rule, it is possible to do with a minimal set of tools: a soldering iron, side cutters, a knife and several screwdrivers.
Gradually, the designs become more complicated, and sooner or later it turns out that without adjustment and tuning they simply will not work. Therefore, you have to acquire thin measuring instruments, and the sooner the better. The older generation of electronics engineers had a pointer tester with such a device.
At present, the switch tester, often called an avometer, has replaced digital multimeter. This can be found in the article "How to use a digital multimeter." Although the good old pointer tester does not give up its positions, and in some cases its use is preferable in comparison with a digital device.
Both of these devices allow you to measure direct and alternating voltages, currents and resistances. If constant voltages are easy to measure, it is enough to know only the value, then with alternating voltages there are some nuances.
The fact is that both pointer and modern digital devices are designed to measure a sinusoidal alternating voltage, and, in a rather limited frequency range: the result of the measurement will be the actual value of the alternating voltage.
If such devices measure voltage of a rectangular, triangular or sawtooth shape, then the readings on the scale of the device, of course, will be, but you do not have to vouch for the accuracy of the measurements. Well, there’s just tension, and which one is not exactly known. And how to be in such cases, how to continue the repair and development of new, increasingly complex electronic circuits? Here the radio amateur comes to the stage when you have to purchase an oscilloscope.
A bit of history
With the help of this device you can see with your own eyes what is happening in electronic circuits: what is the form of the signal, where it appeared or disappeared, the time and phase relationships of the signals. To observe several signals, at least a two-beam oscilloscope is required.
Here we can recall a distant story, when in 1969 the five-beam oscilloscope C1-33, which was mass-produced by the Vilnius Plant, was created. The device used a CRT 22LO1A, which was used only in this development. The customer of this device was, of course, the military-industrial complex.
Structurally, this apparatus was made of two blocks placed on a rack with wheels: the oscilloscope itself and the power supply. The total weight of the structure was 160 kg! The scope included an RFK-5 recording camera attached to the screen, which ensured the recording of waveforms on film. The appearance of the C1-33 five-beam oscilloscope with the camera installed is shown in Figure 1.
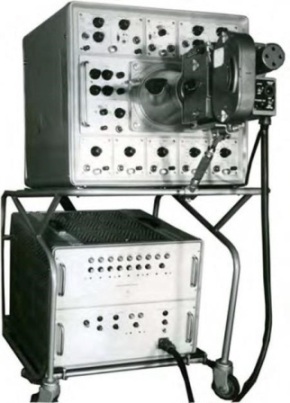
Figure 1. Five-beam oscilloscope C1-33, 1969
Modern electronics make it possible to create handheld digital oscilloscopes the size of a mobile phone. One of such devices is shown in Figure 2. But this will be discussed later.
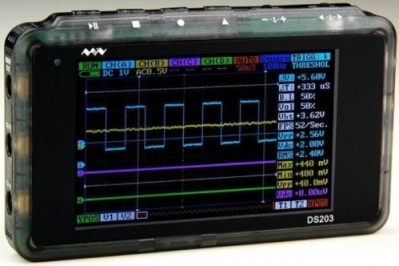
Figure 2. DS203 Pocket Digital Oscilloscope
Oscilloscopes of various types
Until recently, several types of electron beam oscilloscopes were produced. First of all, these are universal oscilloscopes, which are most often used for practical purposes. In addition to them, storage oscilloscopes based on storage CRTs, high-speed, stroboscopic, and special ones were also produced. The latter types were intended for various specific scientific problems, which modern digital oscilloscopes are currently successfully coping with. Therefore, further we will focus on universal general-purpose electronic oscilloscopes.
CRT device
The main part of the electronic oscilloscope, of course, is the cathode ray tube - CRT. Its device is shown in Figure 3.
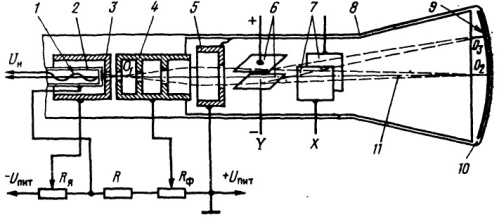
Figure 3. CRT device
Structurally, a CRT is a long glass cylinder 10 of a cylindrical shape with a cone-shaped extension. The bottom of this extension, which is a CRT screen, is coated with a phosphor that emits a visible glow when an electron beam hits it 11. Many CRTs have a rectangular screen with divisions applied directly to the glass. It is this screen that is the indicator of the oscilloscope.
An electron beam is formed by an electron gun
Heater 1 heats the cathode 2, which begins to emit electrons. In physics, this phenomenon is called thermionic emission. But the electrons emitted by the cathode will not fly far away, they will just sit back on the cathode. To obtain a beam from these electrons, several more electrodes are required.
This is the focusing electrode 4 and the anode 5 connected to the aquadag 8. Under the influence of the electric field of these electrodes, the electrons break away from the cathode, accelerate, focus into a thin beam and rush to the screen covered with the phosphor, causing the phosphor to glow. Together, these electrodes are called electron guns.
Reaching the surface of the screen, the electron beam not only causes a glow, but also knocks out secondary electrons from the phosphor, which cause the beam to defocus. The above-mentioned aquadag, which is a graphite coating of the inner surface of the tube, serves to remove these secondary electrons. In addition, aquadag to some extent shields the beam from external electrostatic fields. But such protection is not enough, therefore, the cylindrical part of the CRT, where the electrodes are located, is placed in a metal screen made of electrical steel or permalloy.
A modulator 3 is located between the cathode and the focusing electrode. Its purpose is to control the beam current, which allows the beam to be extinguished during the reverse sweep and highlighted during the forward stroke. In amplification lamps, this electrode is called a control grid. The modulator, focusing electrode and anode have central holes through which the electron beam flies.
Deflecting Plates A CRT has two pairs of deflecting plates. These are the plates of the vertical deflection of the beam 6 — the plate Y, to which the signal under investigation is supplied, and the plates of the horizontal deflection 7 — the plate X, and the horizontal voltage is applied to them. If the deflection plates are not connected anywhere, a luminous dot should appear in the center of the CRT screen. In the figure, this is the point O2. Naturally, the supply voltage must be applied to the handset.
This is where an important point should be made. When the dot stands still, without moving anywhere, it can simply burn the phosphor, and a black dot will forever remain on the CRT screen. This can happen during the repair process of the oscilloscope or with the self-production of a simple amateur device.Therefore, in this mode, you should reduce the brightness to a minimum and defocus the beam - you can still see if there is a beam or it is absent.
When a certain voltage is applied to the deflection plates, the beam will deviate from the center of the screen. In Figure 3, the beam deflects to point O3. If the voltage changes, the beam will draw a straight line on the screen. It is this phenomenon that is used to create the image of the studied signal on the screen. To obtain a two-dimensional image on the screen, two signals must be applied: the test signal — applied to the Y plates, and the scanning voltage — applied to the X plates. We can say that a graph with the coordinate axes X and Y is obtained on the screen.
Horizontal scan
It is the horizontal scan that forms the X axis of the graph on the screen.
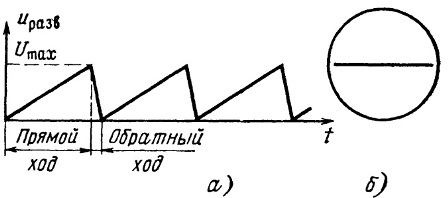
Figure 4. Sweep voltage
As can be seen in the figure, the horizontal scan is carried out by sawtooth voltage, which can be divided into two parts: forward and reverse (Fig. 4a). During the forward stroke, the beam moves uniformly across the screen from left to right, and upon reaching the right edge quickly returns. This is called a reverse stroke. During the forward stroke, a backlight pulse is generated, which is fed to the tube modulator, and a luminous dot appears on the screen, drawing a horizontal line (Fig. 4b).
The forward voltage, as shown in Figure 4, starts from zero (a beam in the center of the screen) and changes to a voltage of Umax. Therefore, the beam will move from the center of the screen to the right edge, i.e. just half the screen. To start the scan from the left edge of the screen, the beam is shifted to the left by applying bias voltage to it. The beam offset is controlled by a handle on the front panel.
During the return stroke, the backlight pulse ends and the beam goes out. The relative position of the backlight pulse and the sawtooth sweep voltage can be seen on the oscilloscope functional diagram shown in Figure 5. Despite the variety of oscilloscope circuit diagrams, their functional circuits are approximately the same, similar to those shown in the figure.
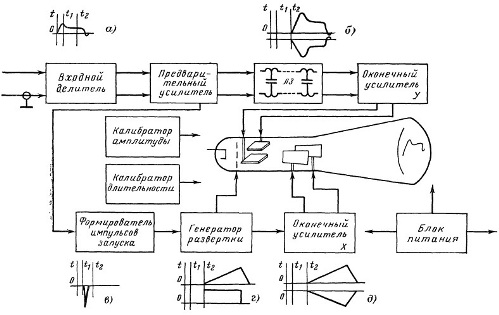
Figure 5. Functional diagram of the oscilloscope
CRT sensitivity
It is determined by the deviation coefficient, showing how many millimeters the beam deflects when a constant voltage of 1 V is applied to the plates. For various CRTs, this value is in the range 0.15 ... 2 mm / V. It turns out that by applying a voltage of 1 V to the deflecting plates, the beam can move the beam by only 2 mm, and this is in the best case. To deflect the beam by one centimeter (10 mm), a voltage of 10/2 = 5V is required. With a sensitivity of 0.15 mm / V for the same movement, 10 / 0.15 = 66.666V will be needed.
Therefore, in order to obtain a noticeable deviation of the beam from the center of the screen, the signal under investigation is amplified by a vertical channel amplifier to several tens of volts. The channel of horizontal amplification, with which a scan is carried out, has the same output voltage.
Most universal oscilloscopes have a maximum sensitivity of 5mV / cm. When using a CRT of type 8LO6I with an input voltage of 5 mV, deflecting plates will require a voltage of 8.5 V to move the beam 1 cm. It is easy to calculate that this will require amplification more than 1,500 times.
Such an gain must be obtained in the entire passband, and the higher the frequency, the lower the gain, which is inherent in any amplifiers. The passband is characterized by an upper frequency f up. At this frequency, the gain of the vertical deflection channel decreases by 1.4 times or by 3 dB. For most universal oscilloscopes, this band is 5 MHz.
And what will happen if the frequency of the input signal exceeds the upper frequency, for example, 8 ... 10 MHz? Will she be able to see it on the screen? Yes, it will be visible, but the signal amplitude cannot be measured. You can only make sure that there is a signal or not. Sometimes such information is quite enough.
Channel vertical deviation. Input divider
The studied signal is fed to the input of the channel of the vertical deviation through the input divider, shown in Figure 6. Often the input divider is called an attenuator.
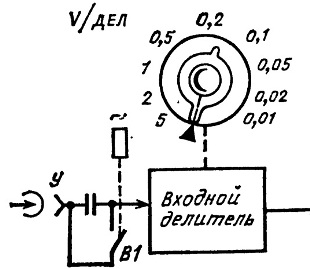
Figure 6. The input divider of the channel vertical deviation
Using the input divider, it becomes possible to study the input signal from a few millivolts to several tens of volts. In the case when the input signal exceeds the capabilities of the input divider, input probes with a division ratio of 1:10 or 1:20 are used. Then the limit of 5V / div becomes 50V / div or 100V / div, which makes it possible to study signals with significant voltages.
Open and closed entrance
Here (Figure 6), you can see switch B1, which makes it possible to apply a signal through a capacitor (closed input) or directly to the input of the divider (open input). When using the "closed input" mode, it is possible to study the variable component of the signal, ignoring its constant component. The simple diagram shown in Figure 7 will help explain what has been said. The diagram is created in the Multisim program, so that everything in these figures, although virtually, is fairly fair.
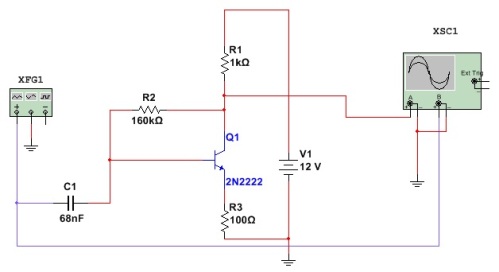
Figure 7. Amplifier stage on a single transistor
An input signal with an amplitude of 10 mV through a capacitor C1 is fed to the base of the transistor Q1. By selecting resistor R2, the voltage on the collector of the transistor is set equal to half the supply voltage (in this case 6V), which allows the transistor to operate in a linear (amplifying) mode. The output is monitored by the XSC1. Figure 8 shows the measurement result in open input mode, on the oscilloscope, the DC (direct current) button is pressed.
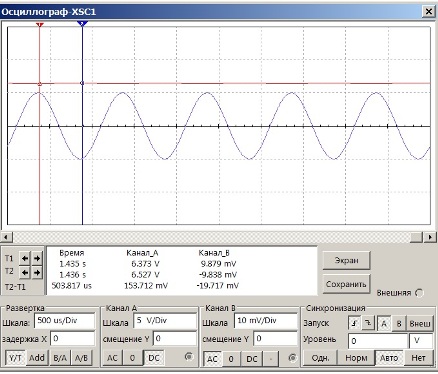
Figure 8. Measurements in open input mode (channel A)
Here you can see (channel A) only the voltage at the collector of the transistor, the same 6V that was just mentioned. The beam in channel A “took off” at 6V, but the amplified sinusoid on the collector did not happen. It simply cannot be discerned with the sensitivity of the 5V / Div channel. Channel A beam in the figure is shown in red.
Signal from the generator is applied to input B, the figure is shown in blue. This is a sine wave with an amplitude of 10 mV.
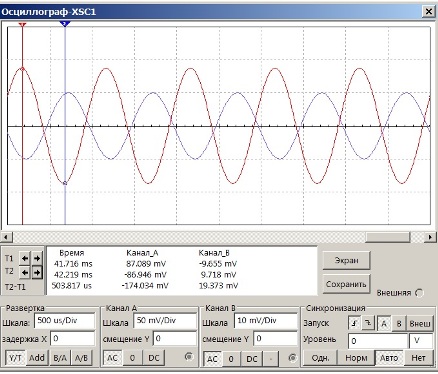
Figure 9. Measurements in closed input mode
Now, press the AC button in channel A - alternating current, this is actually a closed input. Here you can see the amplified signal - a sinusoid with an amplitude of 87 millivolts. It turns out that the cascade on one transistor amplified the signal with an amplitude of 10 mV by 8.7 times. The numbers in the rectangular window below the screen show the voltages and times at the locations of the markers T1, T2. Similar markers are available in modern digital oscilloscopes. That’s actually all that can be said about open and closed entrances. And now let's continue the story about the vertical deflection amplifier.
Pre amplifier
After the input divider, the signal under investigation goes to the pre-amplifier, and, passing through the delay line, enters the terminal amplifier of channel Y (Figure 5). After the necessary amplification, the signal enters the vertical deflection plates.
The preamplifier splits the input signal into paraphase components to supply it to the terminal amplifier Y. In addition, the input signal from the preamplifier is fed to the sweep trigger, which provides a synchronous image on the screen during the forward sweep.
The delay line delays the input signal relative to the beginning of the sweep voltage, which makes it possible to observe the leading edge of the pulse, as shown in Figure 5 b). Some oscilloscopes do not have a delay line, which, in essence, does not interfere with the study of periodic signals.
Sweep channel
The input signal from the preamplifier is also fed to the input of the sweep trigger.The generated impulse starts the sweep generator, which produces a smoothly rising sawtooth voltage. The slew rate and the sweep voltage period are selected by the Time / Div switch, which makes it possible to study input signals in a wide frequency range.
Such a scan is called internal, i.e. triggering comes from the signal under investigation. Typically, oscilloscopes have a scan switch “Internal / External”, for some reason not shown in the functional diagram in Figure 5. In the external trigger mode, the scan can be triggered not by the signal under investigation, but by some other signal on which the signal under investigation depends.
This could be, for example, a delay line trigger pulse. Then, even with a single-beam oscilloscope, you can measure the time ratio of two signals. But it is better to do this with a two-beam oscilloscope, if it is, of course, at hand.
The duration of the sweep should be selected based on the frequency (period) of the investigated signal. Suppose that the signal frequency is 1KHz, i.e. signal period 1ms. The image of a sinusoid with a scan time of 1ms / div is shown in Figure 10.
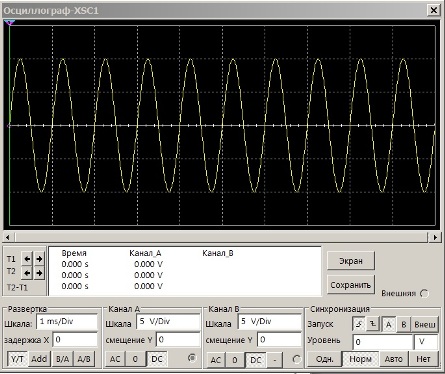
Figure 10
With a scan time of 1ms / div, one 1KHz sine wave period occupies exactly one scale division along the Y axis. The scan is synchronized from beam A along an ascending edge in terms of an input signal level of 0V. Therefore, the sine wave on the screen begins with a positive half-cycle.
If the scan duration is changed to 500 μs / div (0.5 ms / div), then one period of the sinusoid will occupy two divisions on the screen, as shown in Figure 11, which, of course, is more convenient for observing the signal.
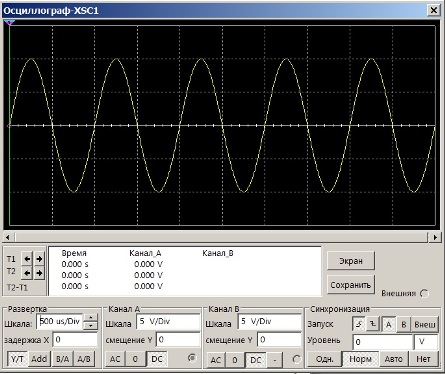
Figure 11
In addition to the sawtooth voltage itself, the sweep generator also generates a backlight pulse, which is fed to the modulator and “ignites” the electron beam (Fig. 5 g). The duration of the backlight pulse is equal to the duration of the forward beam. During the return stroke, there is no backlight pulse and the beam goes out. If there is no beam blanking, something incomprehensible will appear on the screen: the reverse stroke, and even modulated by the input signal, simply crosses out all the useful contents of the waveform.
A sawtooth sweep voltage is supplied to the terminal amplifier of channel X, split into a paraphase signal and fed to the horizontal deflection plates, as shown in Figure 5 (e).
Amplifier X External Input
Not only voltage from the sweep generator, but also external voltage can be supplied to the terminal amplifier X, which makes it possible to measure the frequency and phase of the signal using Lissajous figures.
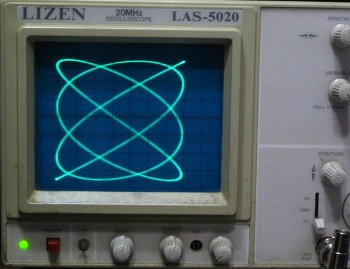
Figure 12. Lissajous figures
But the input switch X is not shown on the functional diagram in Figure 5, as well as the switch of the kind of sweep operations, which was mentioned a bit above.
In addition to channels X and Y, the oscilloscope, like any electronic device, has a power supply. Small-sized oscilloscopes, for example, C1-73, C1-101 can work from a car battery. By the way, for their time, these oscilloscopes were very good, and are still successfully used.
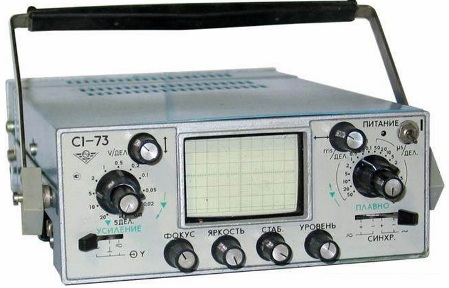
Figure 13. Oscilloscope C1-73
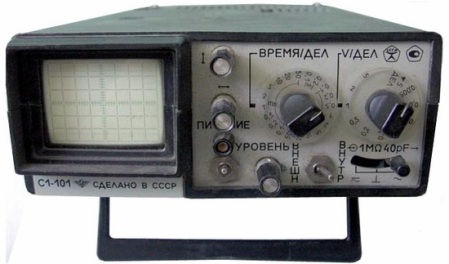
Figure 14. Oscilloscope C1-101
The appearance of the oscilloscopes is shown in Figures 13 and 14. The most surprising is that they are still offered to buy them in online stores. But the price is such that it’s cheaper to buy small-sized digital oscilloscopes on Aliexpress.
Additional oscilloscope devices are built-in amplitude and sweep calibrators. These are, as a rule, fairly stable generators of rectangular pulses, connecting them to the input of the oscilloscope, using the tuning elements you can configure the amplifiers X and Y. By the way, modern calibrators also have such calibrators.
How to use the oscilloscope, methods and methods of measurement will be discussed in the next article.
Continuation of the article: How to use the oscilloscope
Boris Aladyshkin
See also at bgv.electricianexp.com
:
